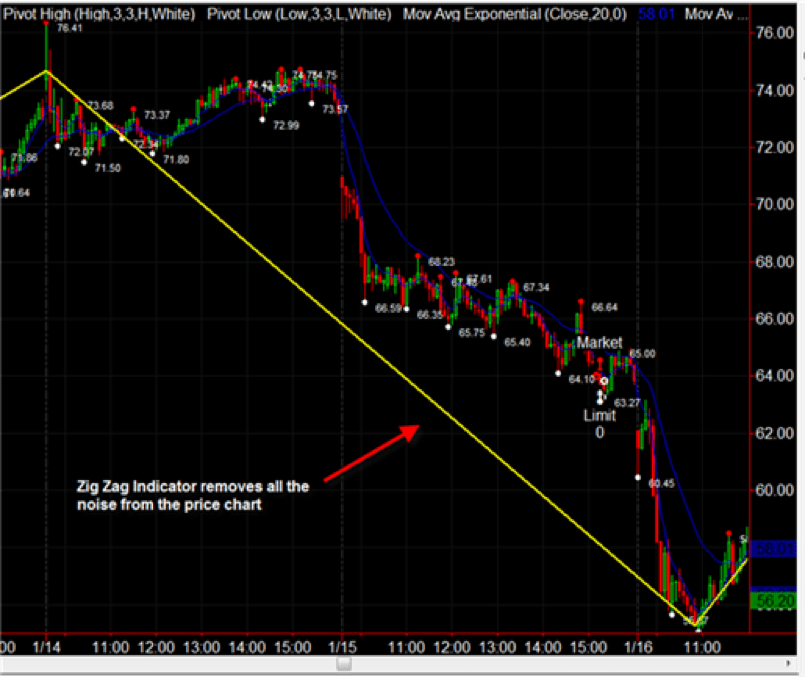
The Zig Zag draws trendlines on charts which connect swing highs and lows. However, it only produces lines when the highs or lows represent a significant price movement. “Significant” is defined by the percentage move threshold set for the Zig Zag.
The chart below shows how the Zig Zag (the yellow line) does not react to any of the insignificant, choppy price fluctuations. It successfully manages to indicate the continuing overall downtrend.
The following chart shows how the Zig Zag operates over time. It reacts by drawing a new trend line only when there is significant price movement. In this case, the “significant” threshold is price change greater than 7%.
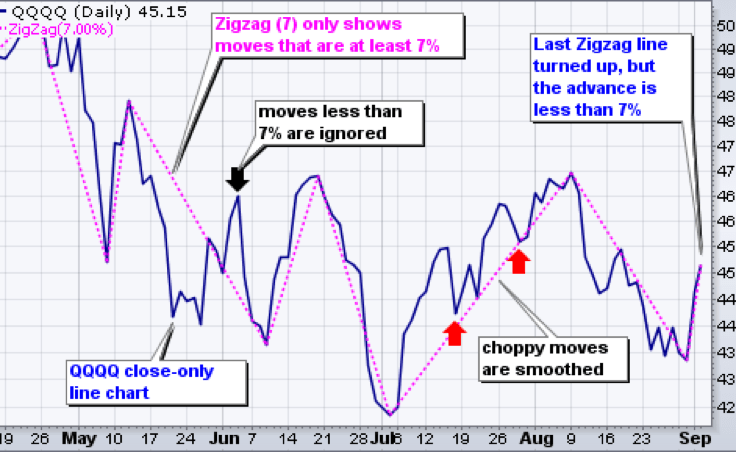
Some versions of the indicator allow analysts to set a minimum absolute price change movement rather than a percentage movement. For example, rather than setting the price change threshold at 5%, it might be set at $20.