Popular technical indicators in Forex trading
Technical indicators are another tool traders can use to get deeper market insights.
If you’re unfamiliar, technical indicators are mathematical calculations plotted on a price chart and they attempt to forecast future price movements. For more information, check out our tutorial on technical analysis.
Moving Averages: the market’s favorite indicators
Now, let’s take a look at some of the most widely used indicators you can add to your trading strategy. Moving averages are so popular because they are easy to use and help traders see the trending movement of an instrument. They can also plot support and resistance.
What are Moving Averages?
A moving average is a technical indicator that smooths out price fluctuations by calculating the average closing price of a Forex pair for a given time period. It is called a “moving” average because it is constantly updated based on the changing price data.
The two main types of moving averages that are useful in Forex trading are simple moving averages (SMAs) and exponential moving averages (EMAs).
Simple Moving Averages (SMAs)
A simple moving average (SMA) is a technical indicator that calculates the simple average of a range of prices in a given time period by adding the prices together and dividing the sum by the number of time periods in the range.
Simple moving averages therefore plot a line on your chart that represents the average price of an instrument, for a specified amount of time. The chart below uses a 10-period MA.
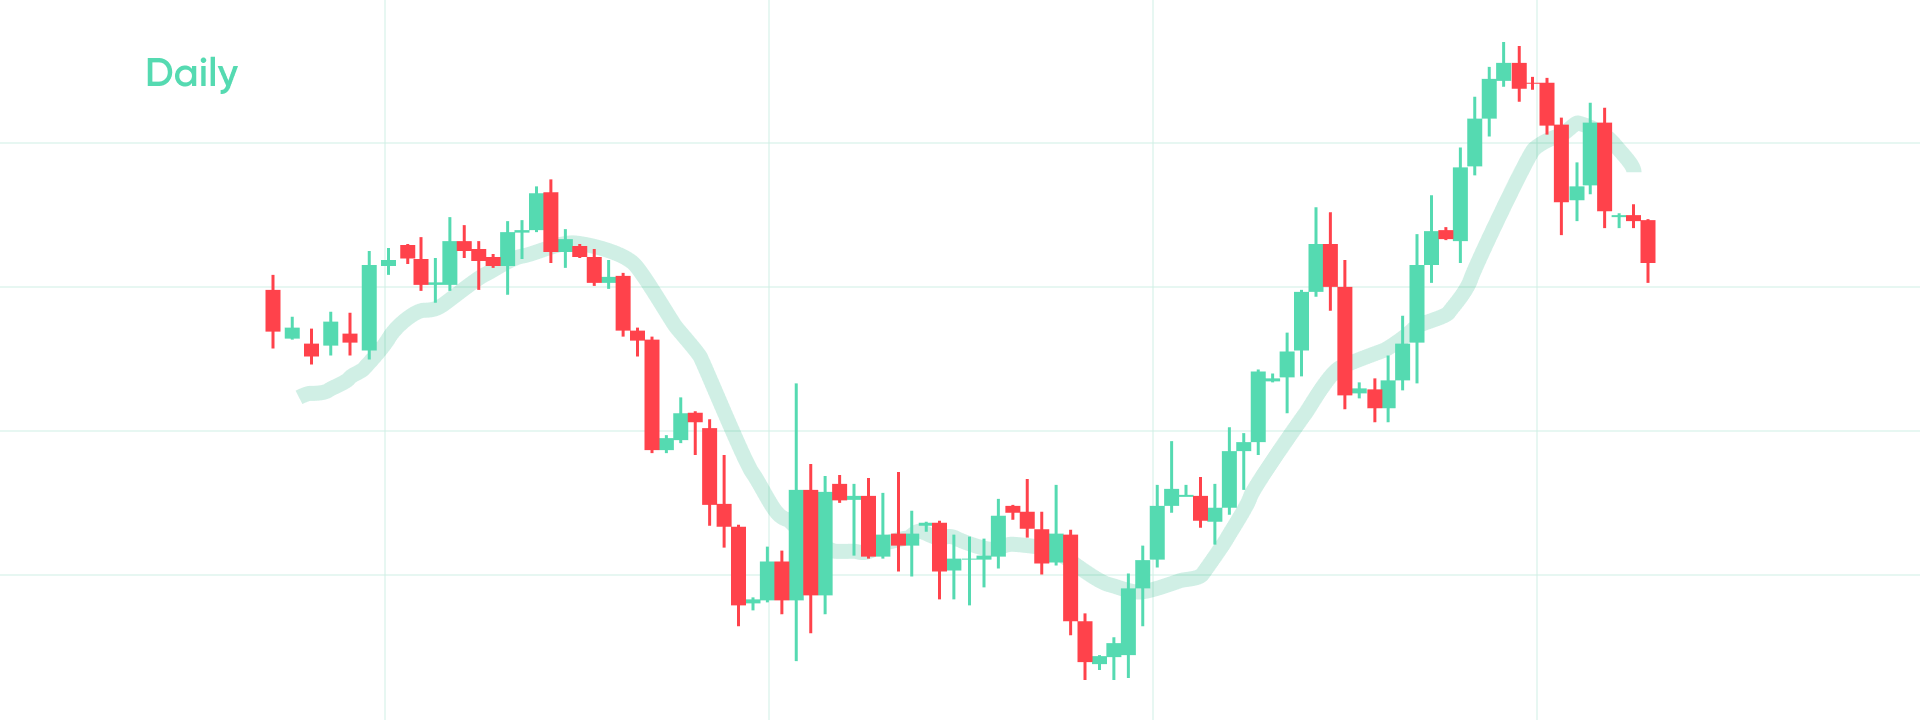
If your chart’s timeframe is set to ‘daily’, the 10-day MA will take the average of 10 candlesticks at a time, since each candlestick plots the price range of a single day. If you use a larger period, the smoother, and less “anchored”, your moving average will be to the fluctuations of the chart. MAs with longer periods, are called “slower”, since they lag behind current price movements.
Exponential Moving Averages (EMAs)
An exponential moving average (EMA) is a technical indicator that gives more weight to the recent price data when calculating the average of a range of prices in a given time period by applying a multiplier to the simple average.
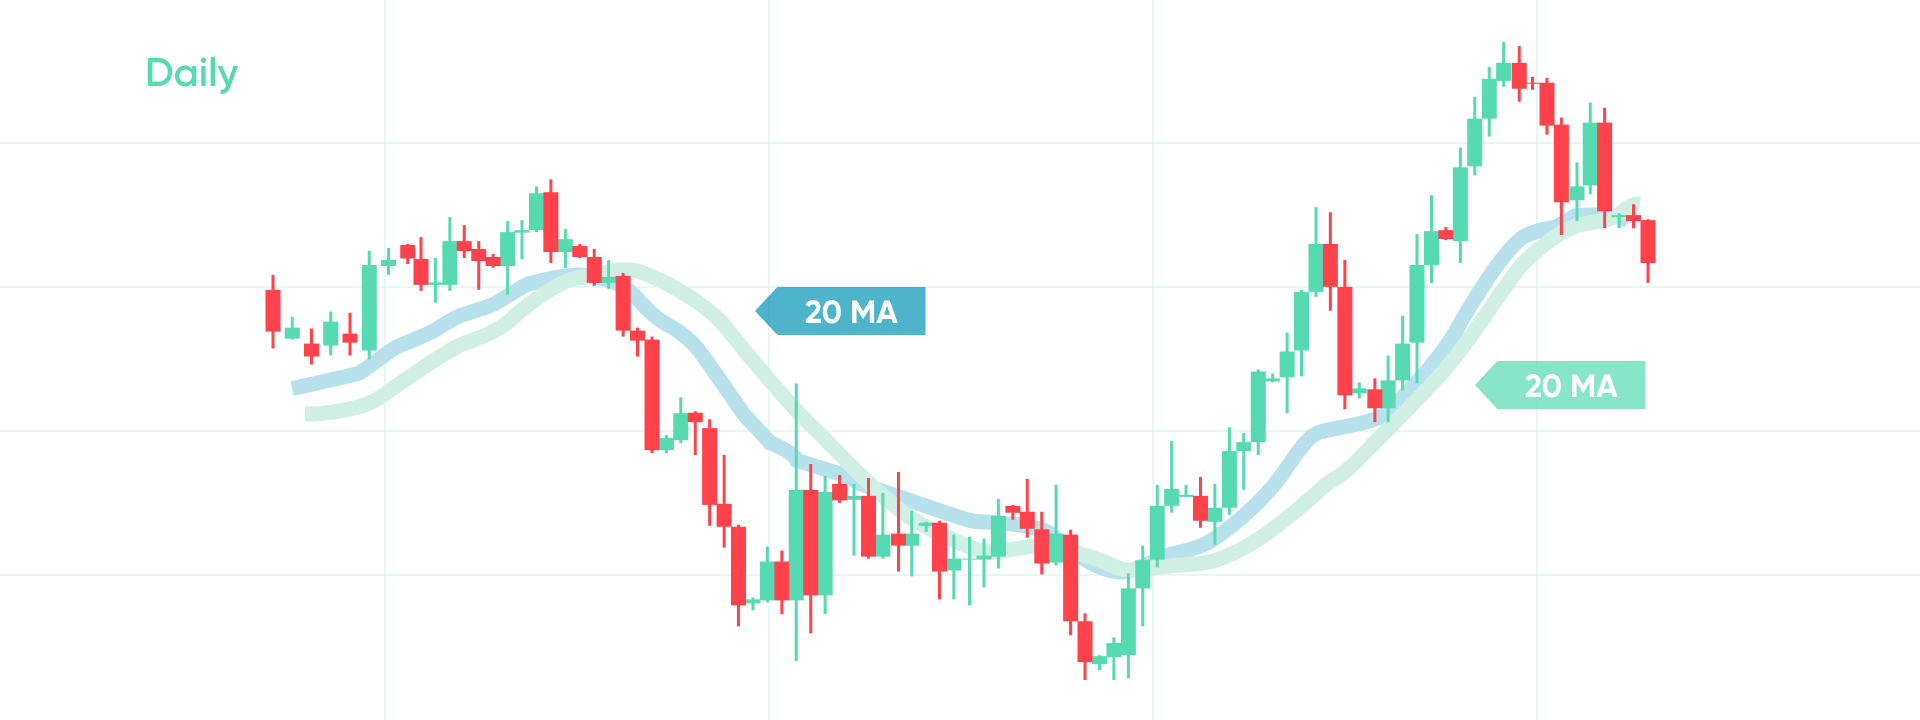
Exponential moving averages follow price movements closer and respond quicker to price changes. That’s because EMAs are more sensitive to recent price movements. This means they respond to abrupt movements that are closer to them but are less responsive to price spikes or drops that are further away.
SMAs vs. EMAs: Which do Forex traders use more?
Both types of moving averages are used by traders to measure trends and plot support/resistance levels. However, different moving averages can work better with different trading strategies. For instance, exponential moving averages are considered more ideal for short-term trades, whereas simple moving averages are generally more suited to long-term trading. This is because EMAs allow traders to respond to recent price fluctuations more quickly while SMAs put more emphasis on the overall trend.
Using Moving Averages to Identify Trends
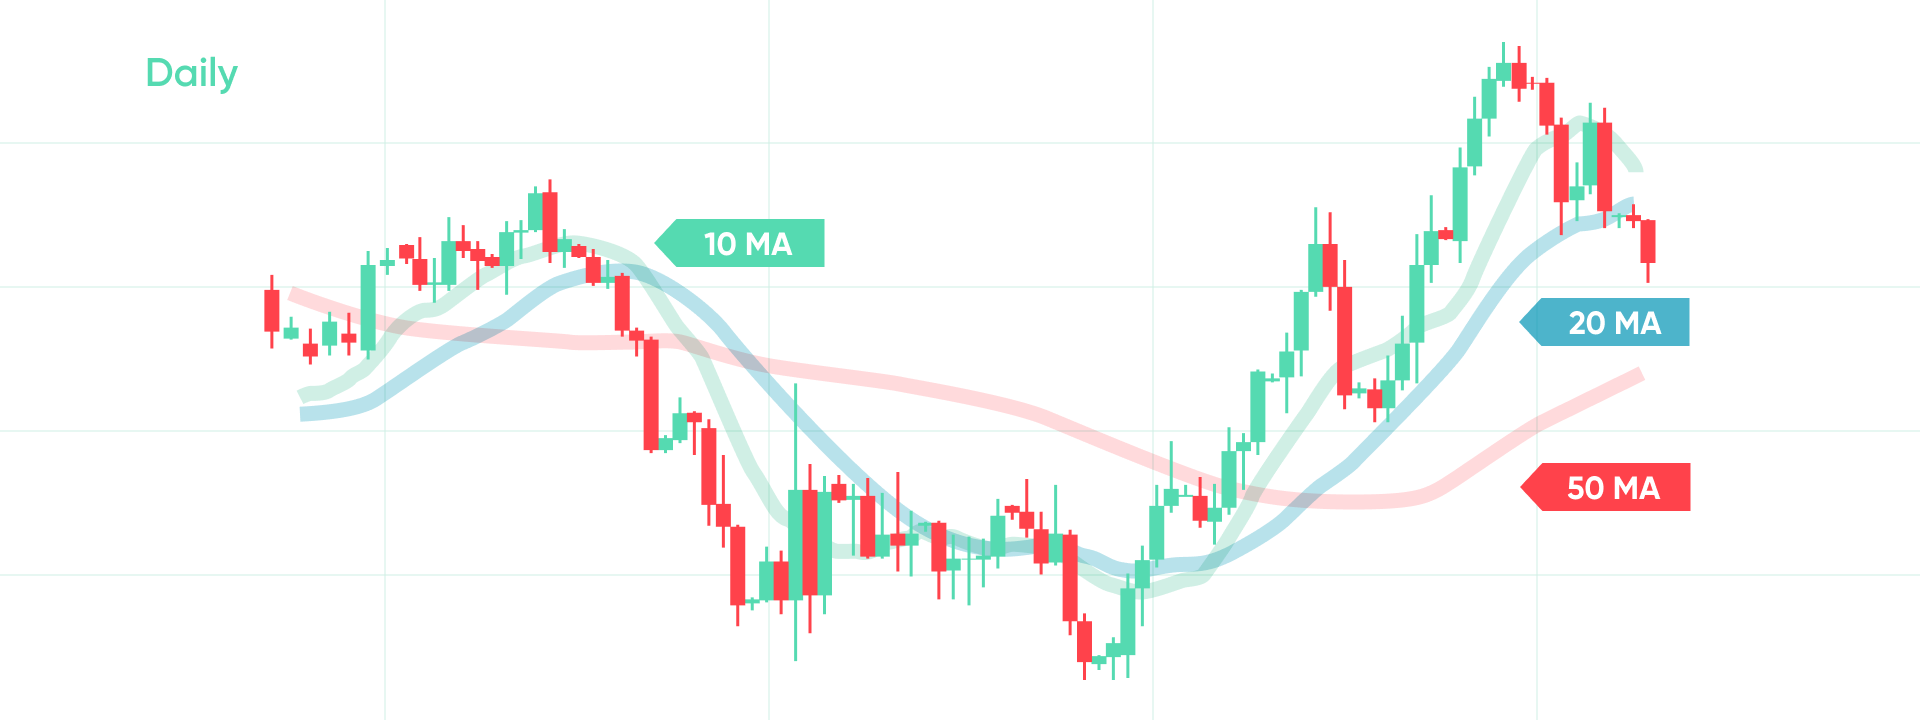
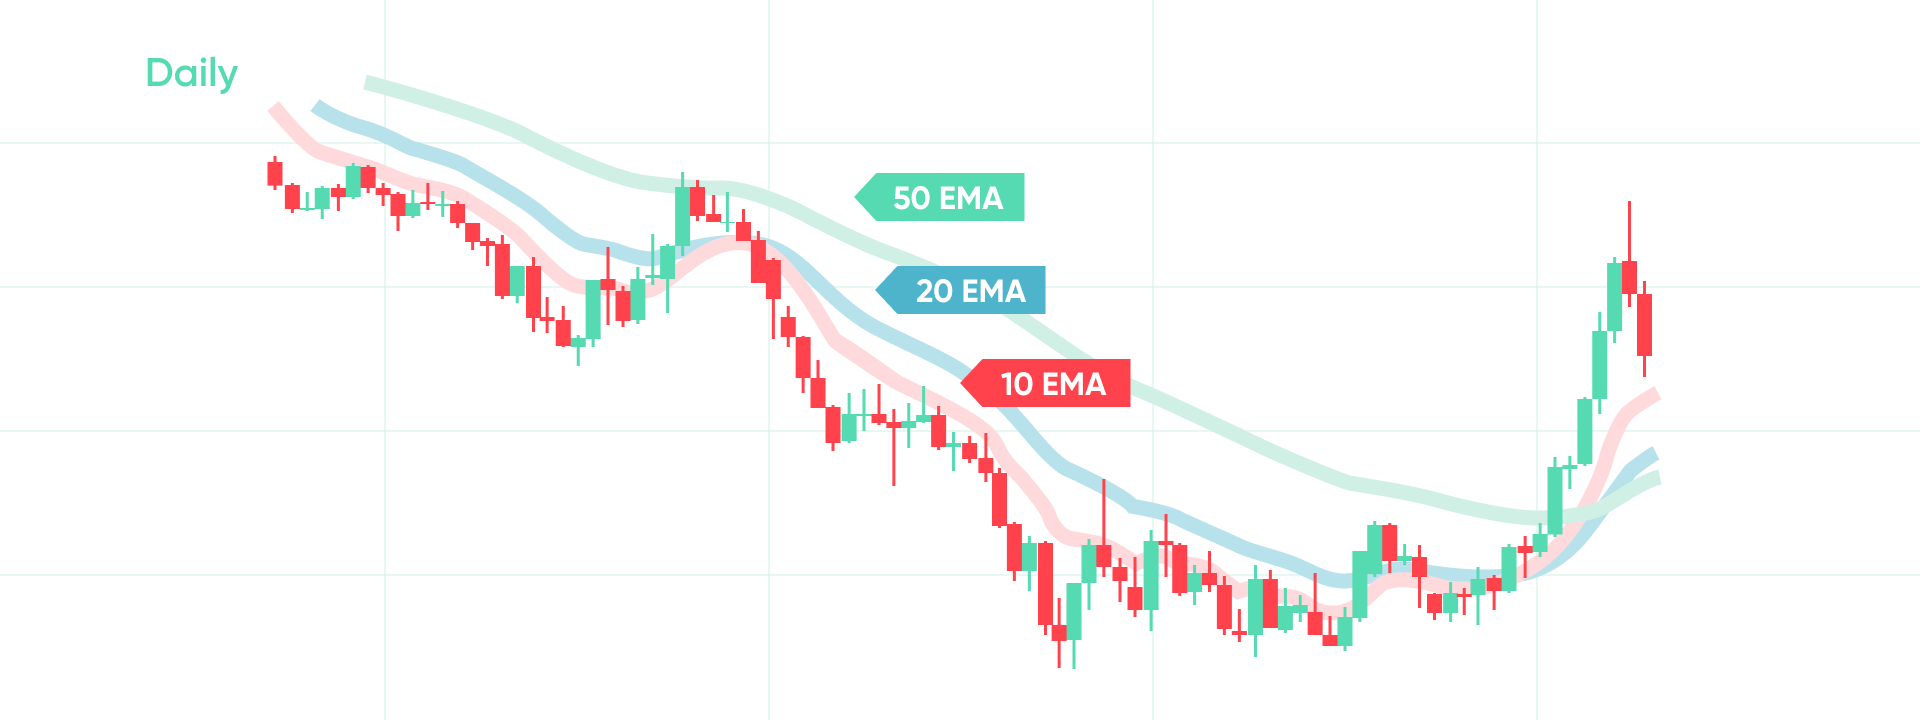
Moving Averages can help traders determine whether an instrument is in an uptrend or a downtrend. This can be done by plotting at least three SMAs or EMAs of different period length i.e. 10-, 20- and 50-period ones. During uptrends the faster MAs move above the slower ones.
During downtrends, the opposite is true i.e. the faster MAs dip below the slower ones.
Moving Average Crossovers: What happens when MAs cross?
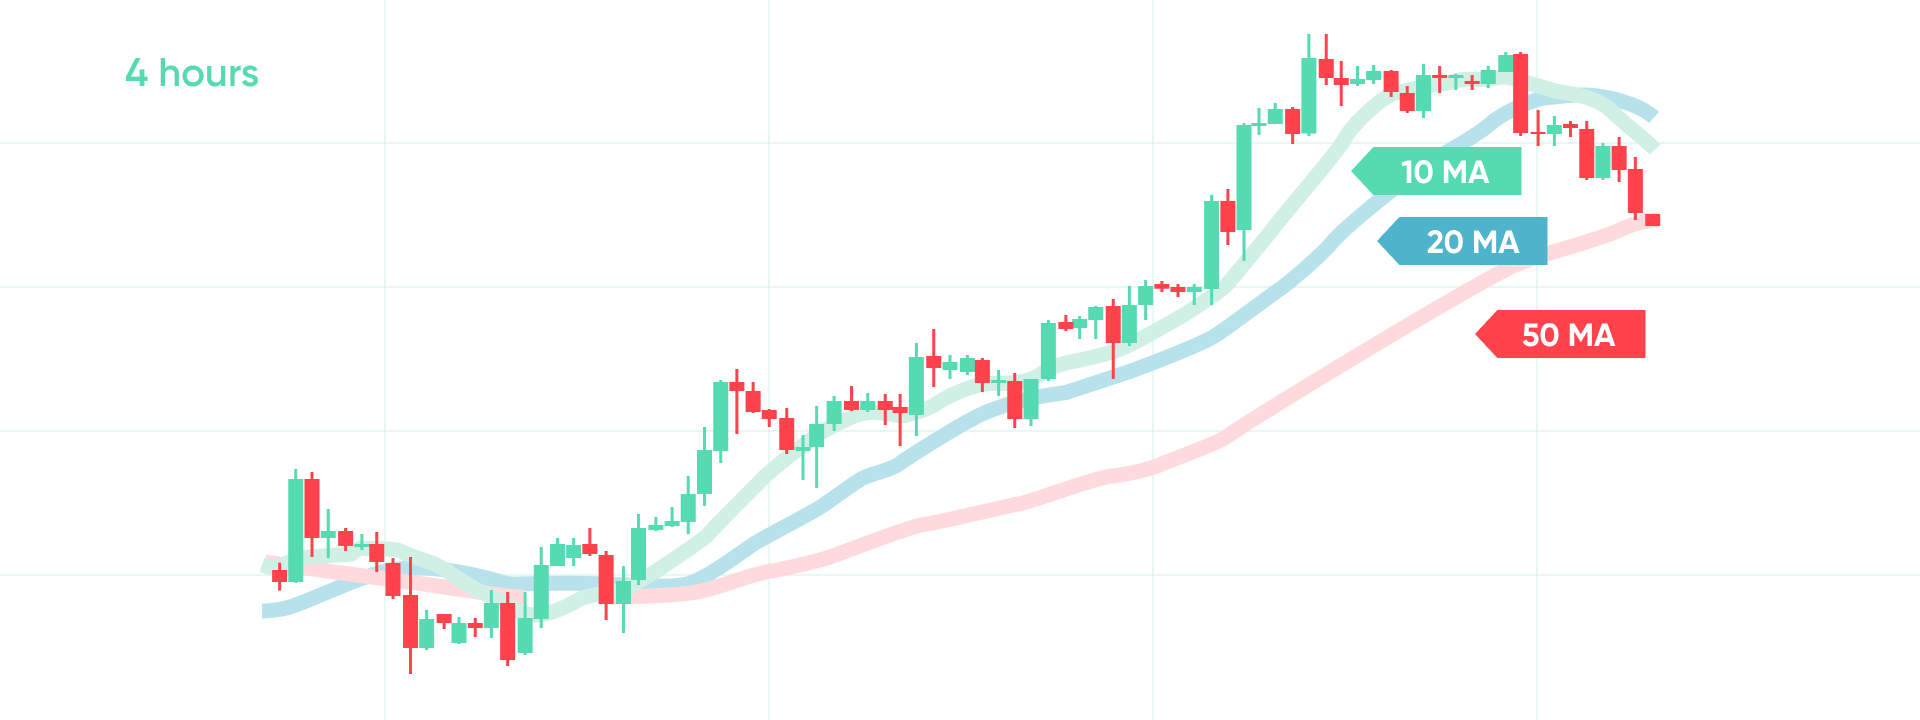
Some traders use the point where MAs cross as an entry and exit point for their trades. The indicator that is underneath shows the trader whether to go short or long. Let’s say the 10 MA crosses the 20 MA around June 9th, like in the picture below, and you open a long position expecting an uptrend. With the conclusion of the uptrend around the 23rd of June, the MAs cross again, and you would close the position.

No analysis method is one hundred percent accurate. Even in the example above, when the 10 MA crosses below the 20 MA on June 7th, and then crosses above it around June 9th, there is little to no value change between the two points the MAs crossed. Thus, a short trade would have yielded very little or no profit at all.
That’s why most traders tend to use a combination of indicators, technical, and fundamental analysis, to get the best possible picture of the markets.
To simplify your trading even further our WebTrader and app offer built in moving averages. Click on the “ƒ” symbol and you’ll find them under ‘Most Popular” in the dropdown menu.