Because the Bollinger Band Squeeze does not provide any directional clues, chartists must use other aspects of technical analysis to anticipate or confirm a directional break. In addition to basic chart analysis, chartists can also apply complimentary indicators to look for signs of buying or selling pressure within the consolidation. Momentum oscillators and moving averages are of little value during a consolidation because these indicators simply flatten along with price action. Instead, chartists should consider using volume-based indicators, such as the Accumulation Distribution Line, Chaikin Money Flow, the Money Flow Index (MFI) or On Balance Volume (OBV). Signs of accumulation increase the chances of an upside breakout, while signs of distribution increase the chances of a downside break.

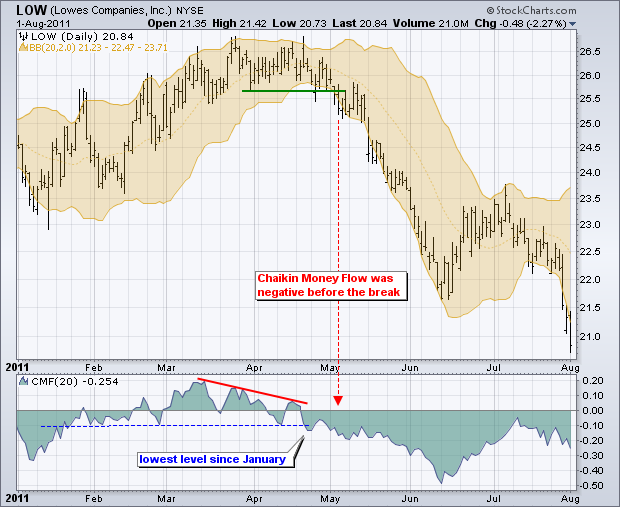
The chart above shows Lowes Companies (LOW) with the Bollinger Band Squeeze occurring in April 2011. The bands moved to their narrowest range in months as volatility contracted. The indicator window shows Chaikin Money Flow weakening in March and turning negative in April. Notice that CMF reached its lowest level since January and continued lower into early May. Negative readings in Chaikin Money Flow reflect distribution or selling pressure that can be used to anticipate or confirm a support break in the stock.

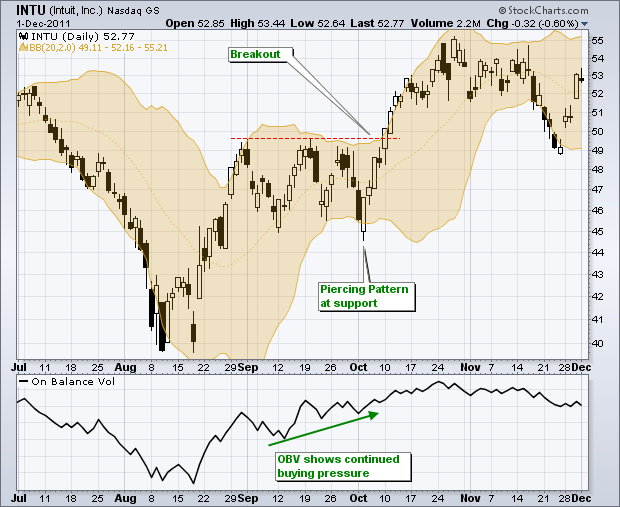
The example above shows Intuit (INTU) with a Bollinger Band Squeeze in September and breakout in early October. During the squeeze, notice how On Balance Volume (OBV) continued to move higher, which showed accumulation during the September trading range. Signs of buying pressure or accumulation increased the chances of an upside breakout.
Before breaking out, the stock opened below the lower band and then closed back above the band. Notice that a piercing pattern formed, which is a bullish candlestick reversal pattern. This pattern reinforced support and the follow-through foreshadowed the upside breakout.
