What are trends and channels?
Trend lines, or trends, are powerful but easy-to-use technical analysis tools that can help you determine whether an instrument’s price is climbing, dropping, or moving sideways. If plotted correctly, they can even show you critical levels of support and resistance.
Channels function in a similar way but can define support and resistance simultaneously, by plotting the top and bottom of a chart’s price movement, while also showing the general trend.
Some traders use trend lines and channels in combination with other indicators, while others use more advanced channel-based indicators like Bollinger bands.
If you want to learn more about support and resistance, check out our earlier tutorial.
How to plot a trend line
The great thing about trend lines? They’re easy to apply to a chart. Just draw a line between three major highs or three significant lows. This should result in a diagonal line moving upwards or downwards at a slight angle, with the wicks (the small black lines on the top and bottom of candlesticks) approaching or touching your line. Just keep in mind that, if your trend line is too steep, it may not be as reliable. If your line is horizontal or flat, then the price is moving sideways, which usually means that supply and demand are balanced.
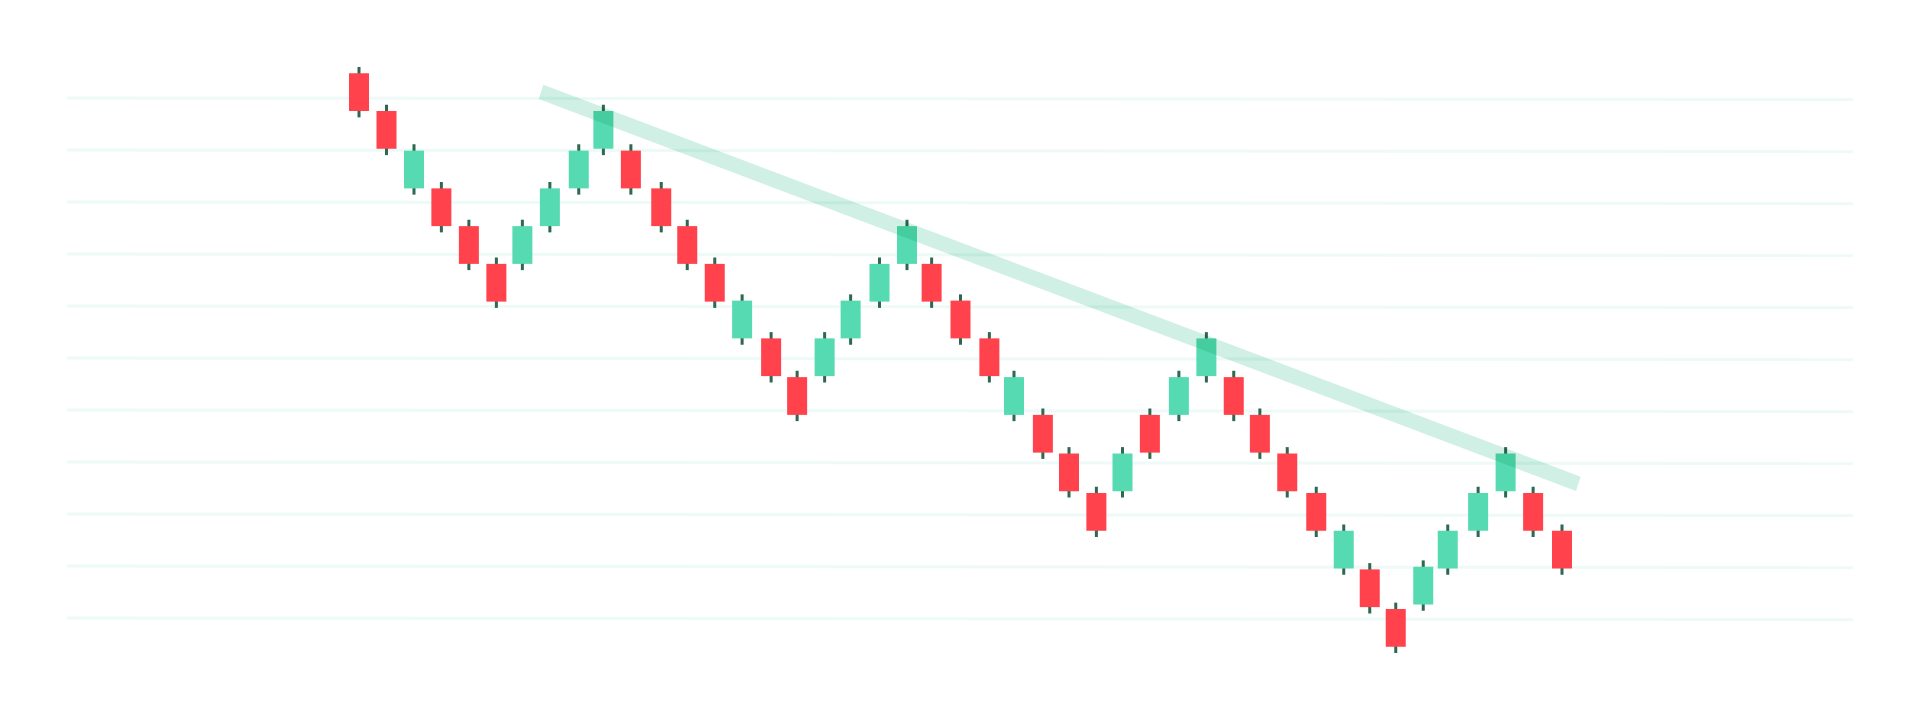
If plotted correctly, the trend line could also roughly define support, if drawn at the bottom of the chart, or resistance, if drawn at the top. A trend line that is tested multiple times is considered stronger. A small side note here. Although you can use as few as two highs or lows to draw a trend line, the trend is only confirmed if the indicator touches, or closely approaches, at least three wicks.
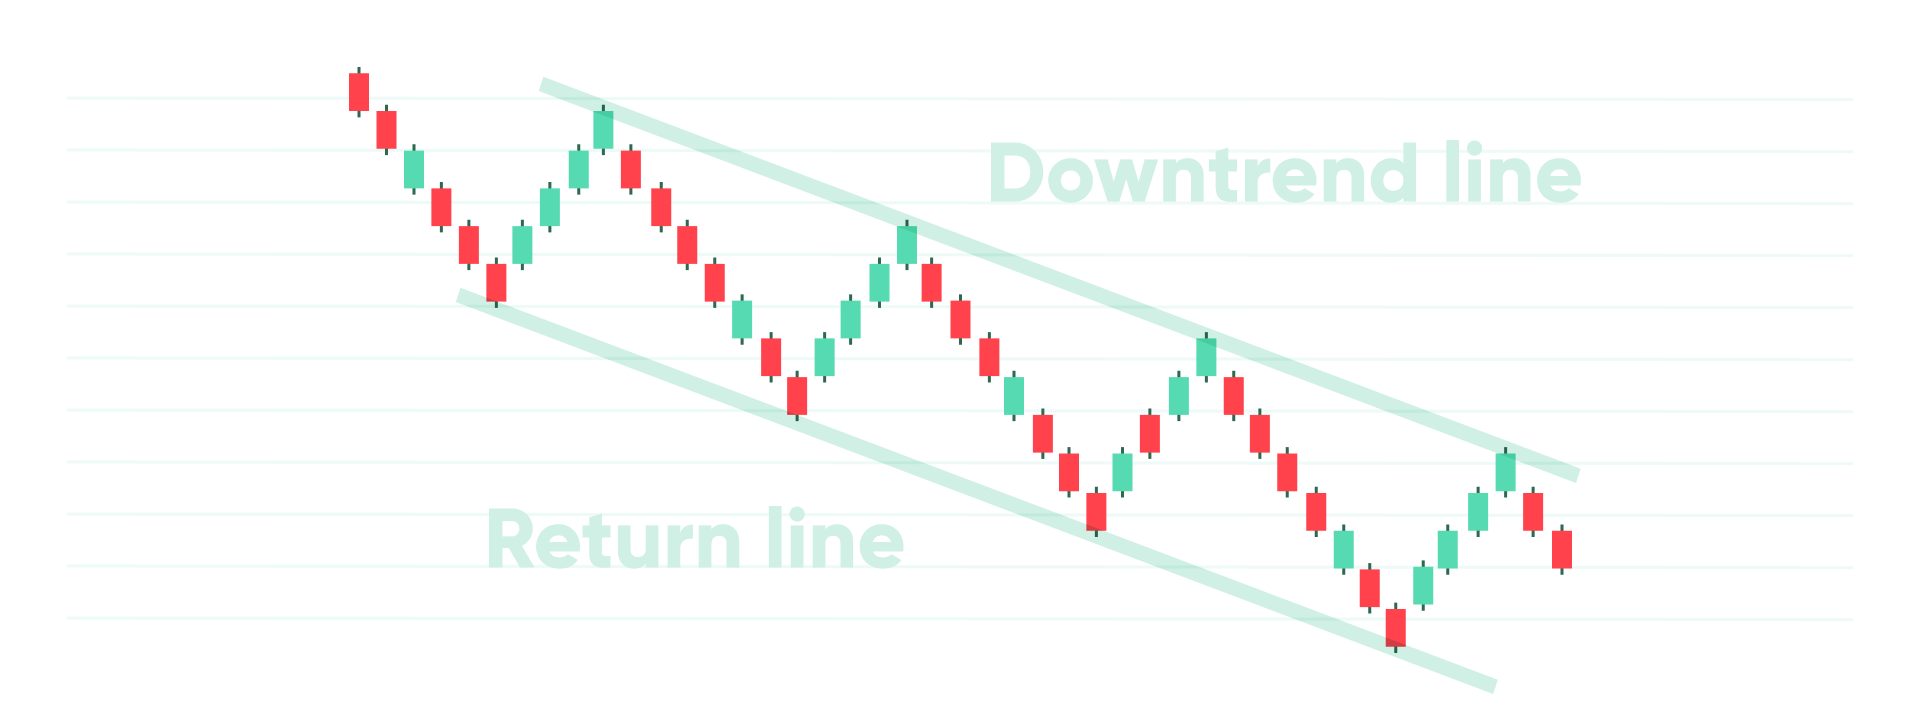
How to plot channels
Channels are an extension of trend lines but are drawn on both the top and bottom of the price chart. Connect at least three highs and three lows, but remember, if your indicators are too steep, they may be unreliable.
How to use trends and channels
Trends and channels can be used for both trading and risk management. A steep trend line or channel may be unreliable and indicate volatility, which can increase risk. But a well-plotted and tested indicator might signal a buy/sell level, or a price where stop loss or take profit orders can be set.
Traders that prefer breakout trading may use the trend lines to decide when to sell – if the price crosses the bottom line – or when to buy – if the top line is crossed.
Remember that support and resistance are ranges, not specific rates. Protect yourself by ensuring that your indicators are confirmed before acting, because a breakout, might end up being a fakeout.