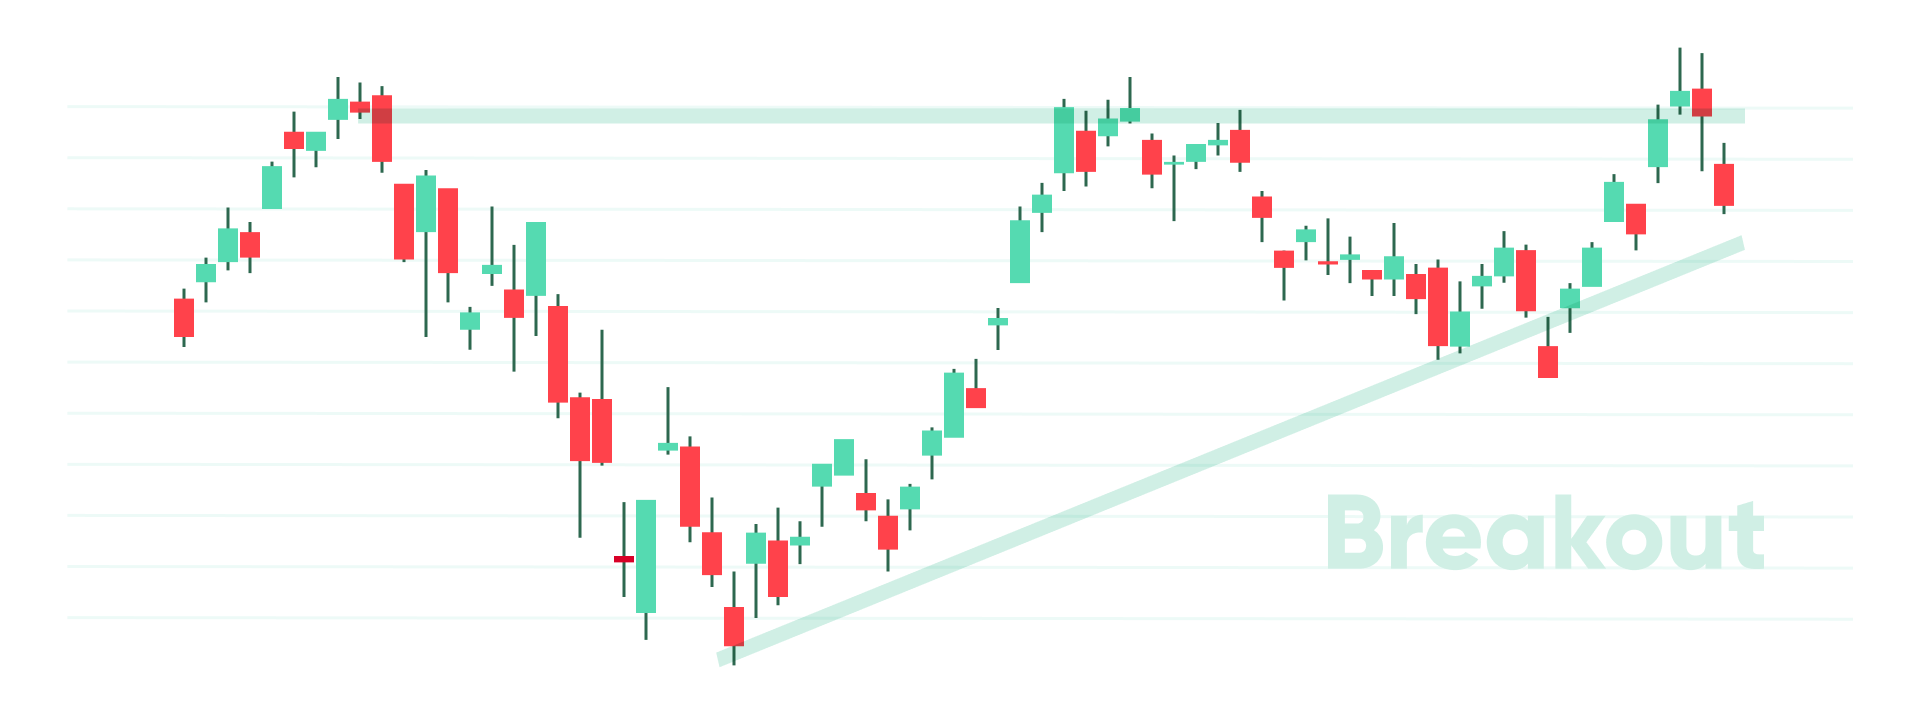
What is a breakout?
We’ve seen how support and resistance levels can act as boundaries, limiting an instrument’s market movements. But these levels can’t hold forever, so, what happens when they are broken? These events are known as breakouts and can often result in significant price movements and increased volatility.
Why do breakouts happen?
If an instrument’s price regularly tests a certain level, it’s likely that, at some point, it will break through. If the level in question was strong, the accompanying price movement can often be even greater. But why do breakouts happen?
Well, trader psychology is a big part of it. When the price of an instrument finally breaks through a strong support or resistance level, traders often react in one of a few set ways, depending on their position in the market.
Firstly, those that had been waiting patiently for the breakout to happen, enter the market, looking to ride the subsequent price movement to its conclusion. Another group, those that had been holding positions in the opposite direction to the breakout, close them to avoid the risk of taking too big a loss. Then, there are the traders that had placed their stop loss or take profit levels in the area of the breakout and, as a result, had their positions closed automatically. Some traders even use software called EAs (expert advisors) to automatically open or close trades at predetermined levels that they assume are where breakouts will happen.
These events happening at the same time can often cause an instrument’s price to rise or fall drastically over a short period following a breakout. That’s why it’s important to have an adequate risk management strategy in place when trading such events. Two very fundamental ways to protect yourself against post-breakout volatility are stop loss and take profit orders. For more about risk management, check out our earlier tutorial.
It’s also worth noting that, when price breaks through a resistance level, that level often becomes a support area. Similarly, when price breaks through a support level, the level tends to become a resistance area. This is known as the change in polarity principle.
When a breakout isn’t a breakout
Always keep in mind that support and resistance levels aren’t exact numbers, and are often subjective. Traders may recognize and analyze levels differently, which often leads them to make contrasting decisions.
Let’s say, for example, the price of an instrument looks set to break through a strong resistance level, after testing that level for a certain amount of time. Some traders may not believe the market is ready for the price to be pushed higher, so, instead, they place orders in the opposite direction.
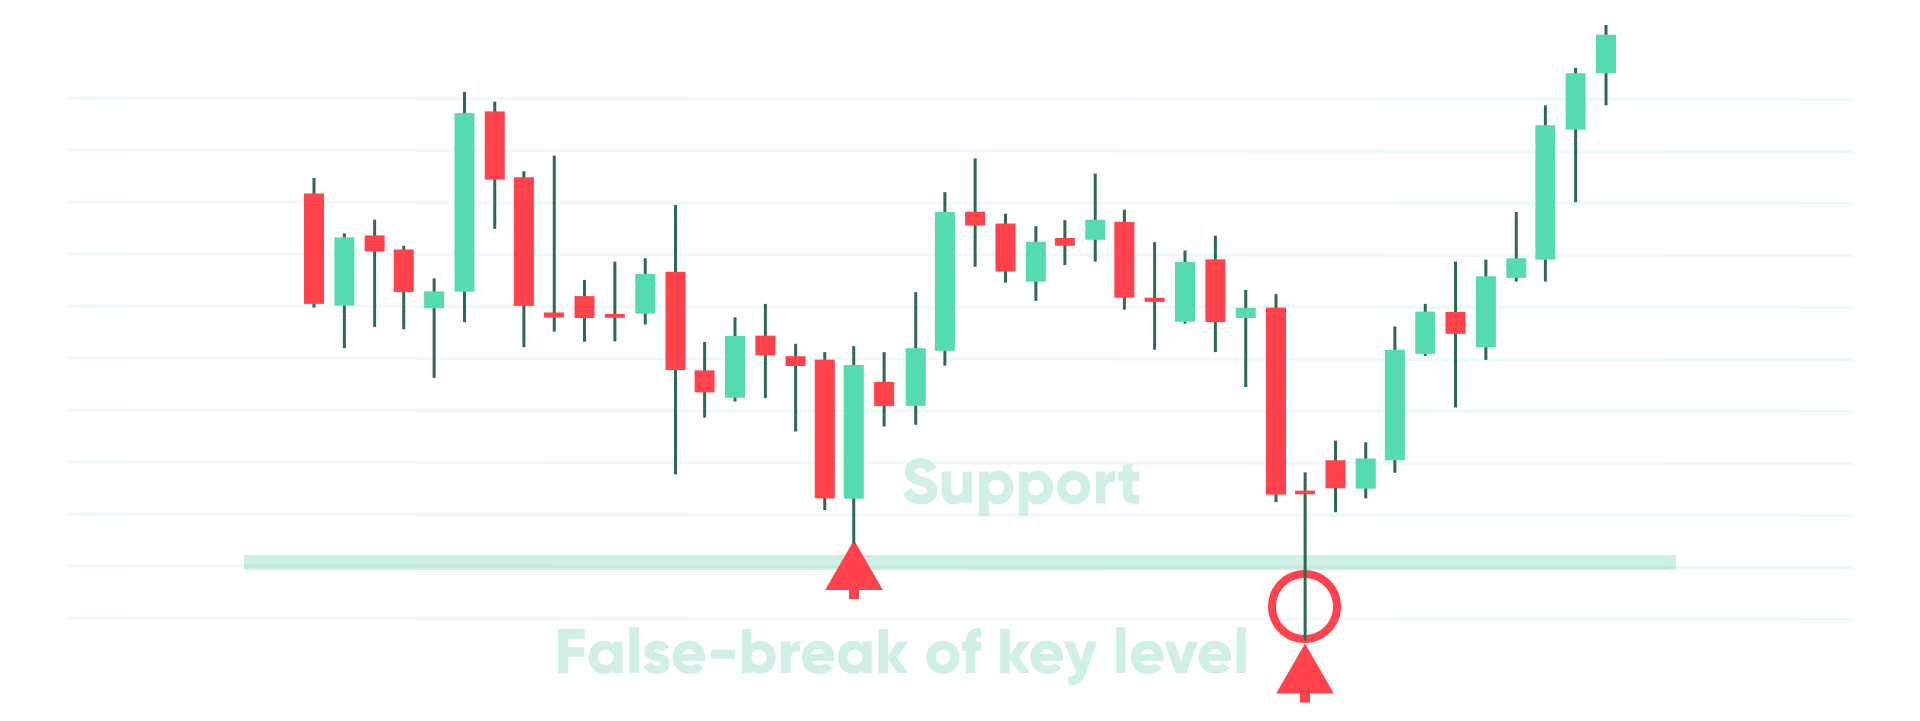
Because of this, the price may seem to break out from the resistance level momentarily, only to drop back through it and possibly even lower. This is known as a fakeout.