What are support and resistance?
Support and resistance are central to technical analysis, acting as possible boundaries that seem to limit an asset’s market movements. Although setting support and resistance levels is by no means an exact science, they are still deemed so important, traders often base their entire strategy on them. But what exactly are these levels and why do they appear?
Supply and demand
Support and resistance levels are intrinsically linked to supply and demand. In the markets, when demand is higher than supply, prices tend to rise as there are more buyers than sellers. On the other hand, when there is more supply than demand, prices tend to fall as the opposite is true.
Support and resistance may also act as turning points. In an upward trending market, for example, when the price of an asset rises only to then pull back, the highest price point reached is considered resistance. The price may have difficulty breaking above this level, as it indicates a surplus of sellers. In other words, at a resistance level, selling is expected to emerge which may prevent further price increases.
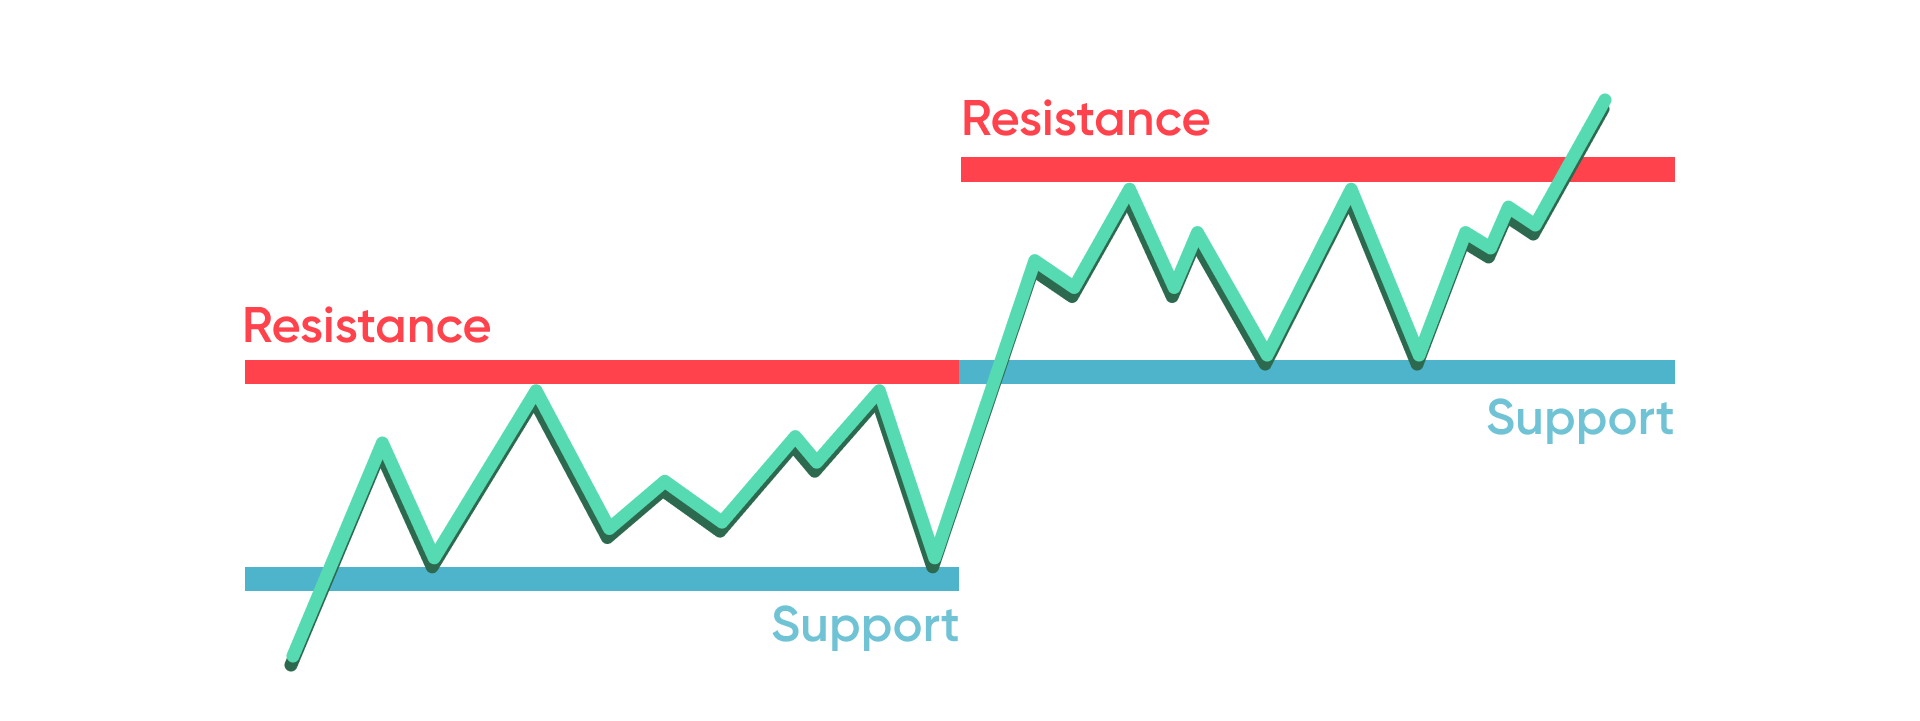
Similarly, during the pullback, before the price rises again, the lowest point reached is considered support. The price may have an equally hard time breaking below this level, as it indicates a surplus of buyers. Meaning, at a support level, buying is expected to emerge which may prevent further price decreases.
Support and resistance levels often appear at psychologically important price levels, such as round-numbers or historical highs and lows.
Plotting support and resistance
So, how do traders plot support and resistance levels on their charts? Well, it’s relatively straightforward. By analyzing movements on a chart, traders can identify price points that the market has reached but has struggled to break through. The more times a price reaches and bounces off these levels, the stronger the support or resistance is considered to be. In fact, these levels often become self-fulfilling prophecies, with traders automatically buying or selling as soon as they are reached.
It is worth noting as well that support and resistance levels are not exact numbers. The market is unlikely to hit the same price level repeatedly before rebounding. As such, it is better to consider them price zones, rather than precise levels.
Things to consider
If you look closely at the charts, you will often see the price touching or, sometimes, slightly breaking through support or resistance before rebounding. In moments like this, the market is considered to be testing the levels.
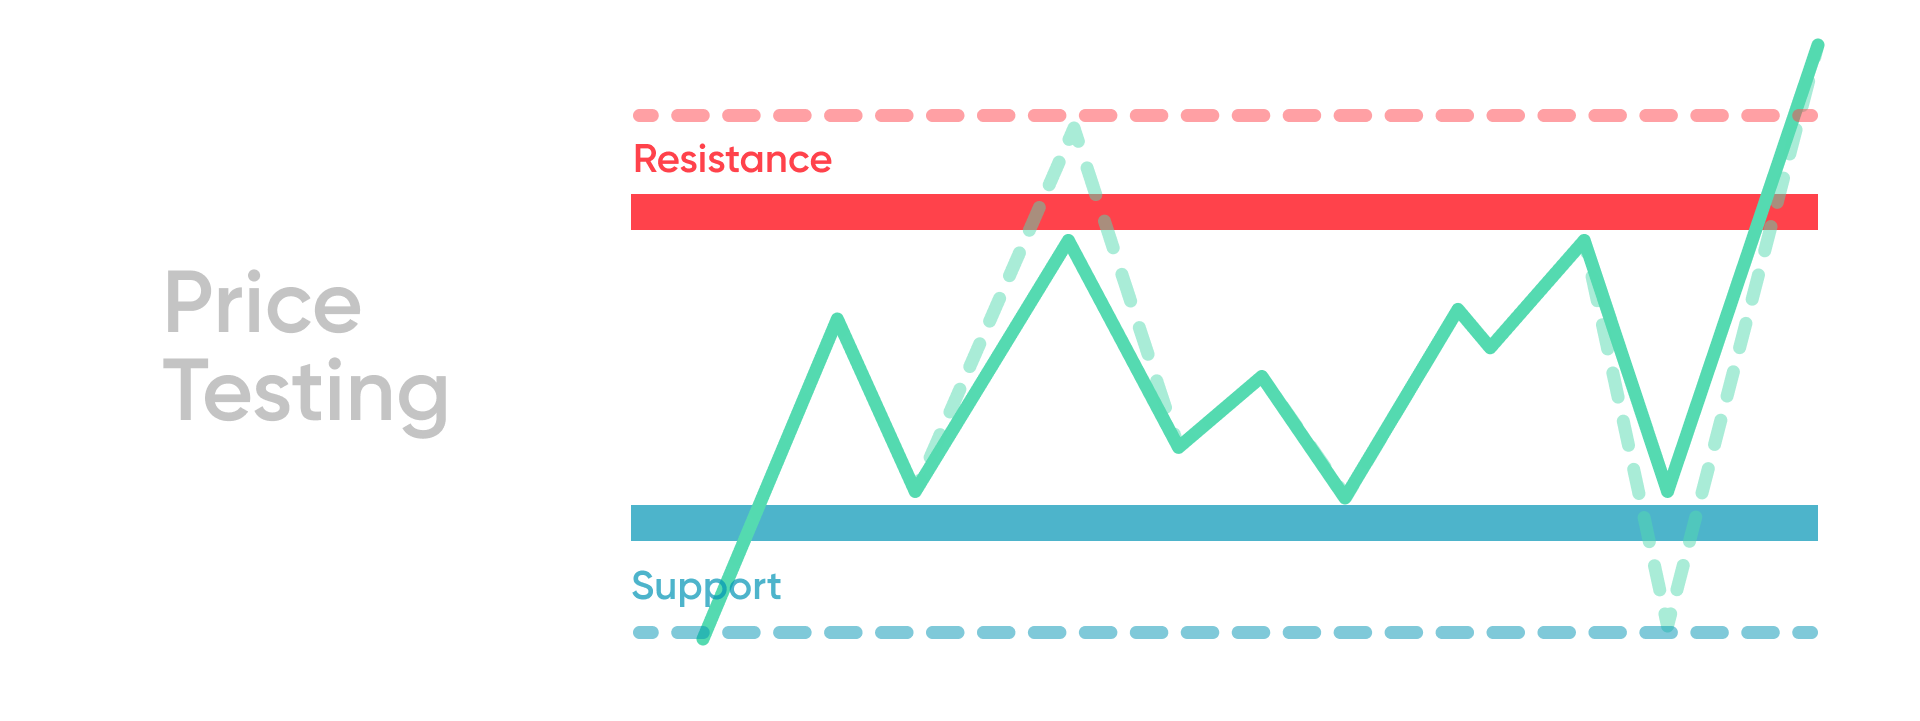
A broken resistance level can sometimes act as support for subsequent price movements. Similarly, if the price breaks through support, that level can later become resistance. When support or resistance levels are broken, the strength of the following trend is often determined by the strength of the levels themselves. If the level had been holding through multiple breakthrough attempts, it may indicate that the resulting trend will be equally strong.