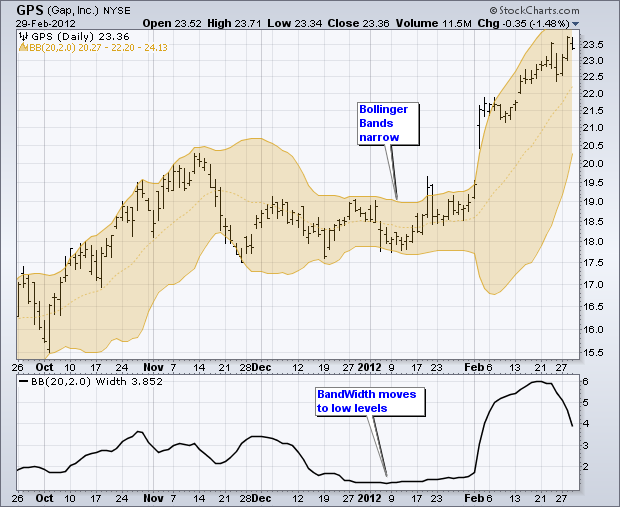
Before looking at the details, let’s review some key indicators for this trading strategy. First, for illustration purposes, note that we are using daily prices and setting the Bollinger Bands at 20 periods and two standard deviations, the default settings. These can be changed to suit one’s trading preferences or the characteristics of the underlying security. Bollinger Bands start with the 20-day SMA of closing prices. The upper and lower bands are then set two standard deviations above and below this moving average. The bands move away from the moving average when volatility expands and towards the moving average when volatility contracts.

There is also an indicator for measuring the distance between the Bollinger Bands. Appropriately, this indicator is called Bollinger BandWidth, or just the BandWidth indicator. It is simply the value of the upper band less the value of the lower band. Understandably, stocks with higher prices tend to have higher BandWidth readings than stocks with lower prices. If price equals 100 and BandWidth equals 5, then BandWidth would be 5% of the price. If price equals 20 and BandWidth equals 1, then BandWidth would also be 5% of price. Keep this in mind when using the indicator.
