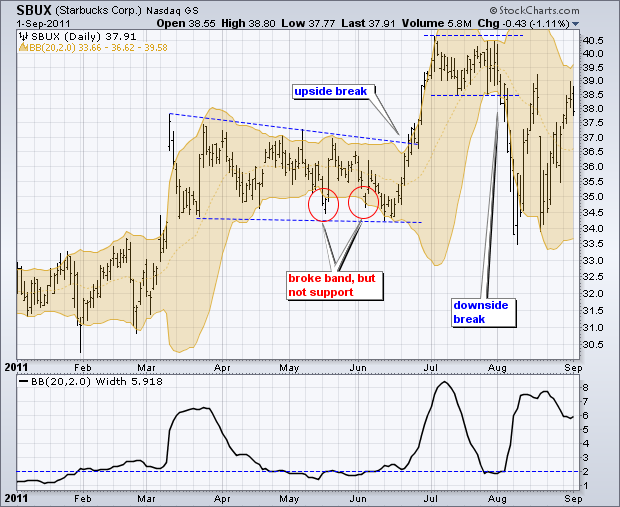
Even though the Bollinger Band Squeeze is straightforward, chartists should at least combine this strategy with basic chart analysis to confirm signals. For example, a break above resistance can be used to confirm a break above the upper band. Similarly, a break below support can be used to confirm a break below the lower band. Unconfirmed band breaks are subject to failure.
The chart below shows Starbucks (SBUX) with two signals within a two-month period, which is relatively rare. After a surge in March, the stock consolidated with an extended trading range. SBUX broke the lower band twice, but did not break support from the mid-March low. Basic chart analysis reveals a falling wedge-type pattern. Notice that this pattern formed after a surge in early March, which makes it a bullish continuation pattern. SBUX subsequently broke above the upper band, then broke resistance for confirmation.

After the surge above 40, the stock again moved into a consolidation phase as the bands narrowed and BandWidth fell back to the low end of its range. Another setup was in the making as the surge and flat consolidation formed a bull flag in July. Despite this bullish pattern, SBUX never broke the upper band or resistance. Instead, SBUX broke the lower band and support, which led to a sharp decline.
