Typically, the price analysis starts on the higher timeframe to get an overall idea of the general chart context and determine the trend environment.
Many traders choose the Daily timeframe as their higher timeframe. The Daily timeframe is a suitable option as a higher timeframe for day traders, but it can also be used for traders entering trades on the 1H or 30min, which are traditionally not considered day trading timeframes.
On the higher timeframe, you identify the overall trend direction. This helps with trade selection because trading into the trend direction of the higher timeframe is generally considered the better trading approach.
Support and resistance levels from the Daily timeframe carry more weight. Therefore, traders should draw their price levels on their higher timeframes first before going to the lower timeframe. Looking for important round numbers and drawing previous supply and demand zones can also be done on the Daily timeframe.
The screenshot of the Daily timeframe below shows the price in a current uptrend. Above the price is a resistance level and a supply zone. Below the current price, we can identify two important support levels and the round number level at 0.8000.
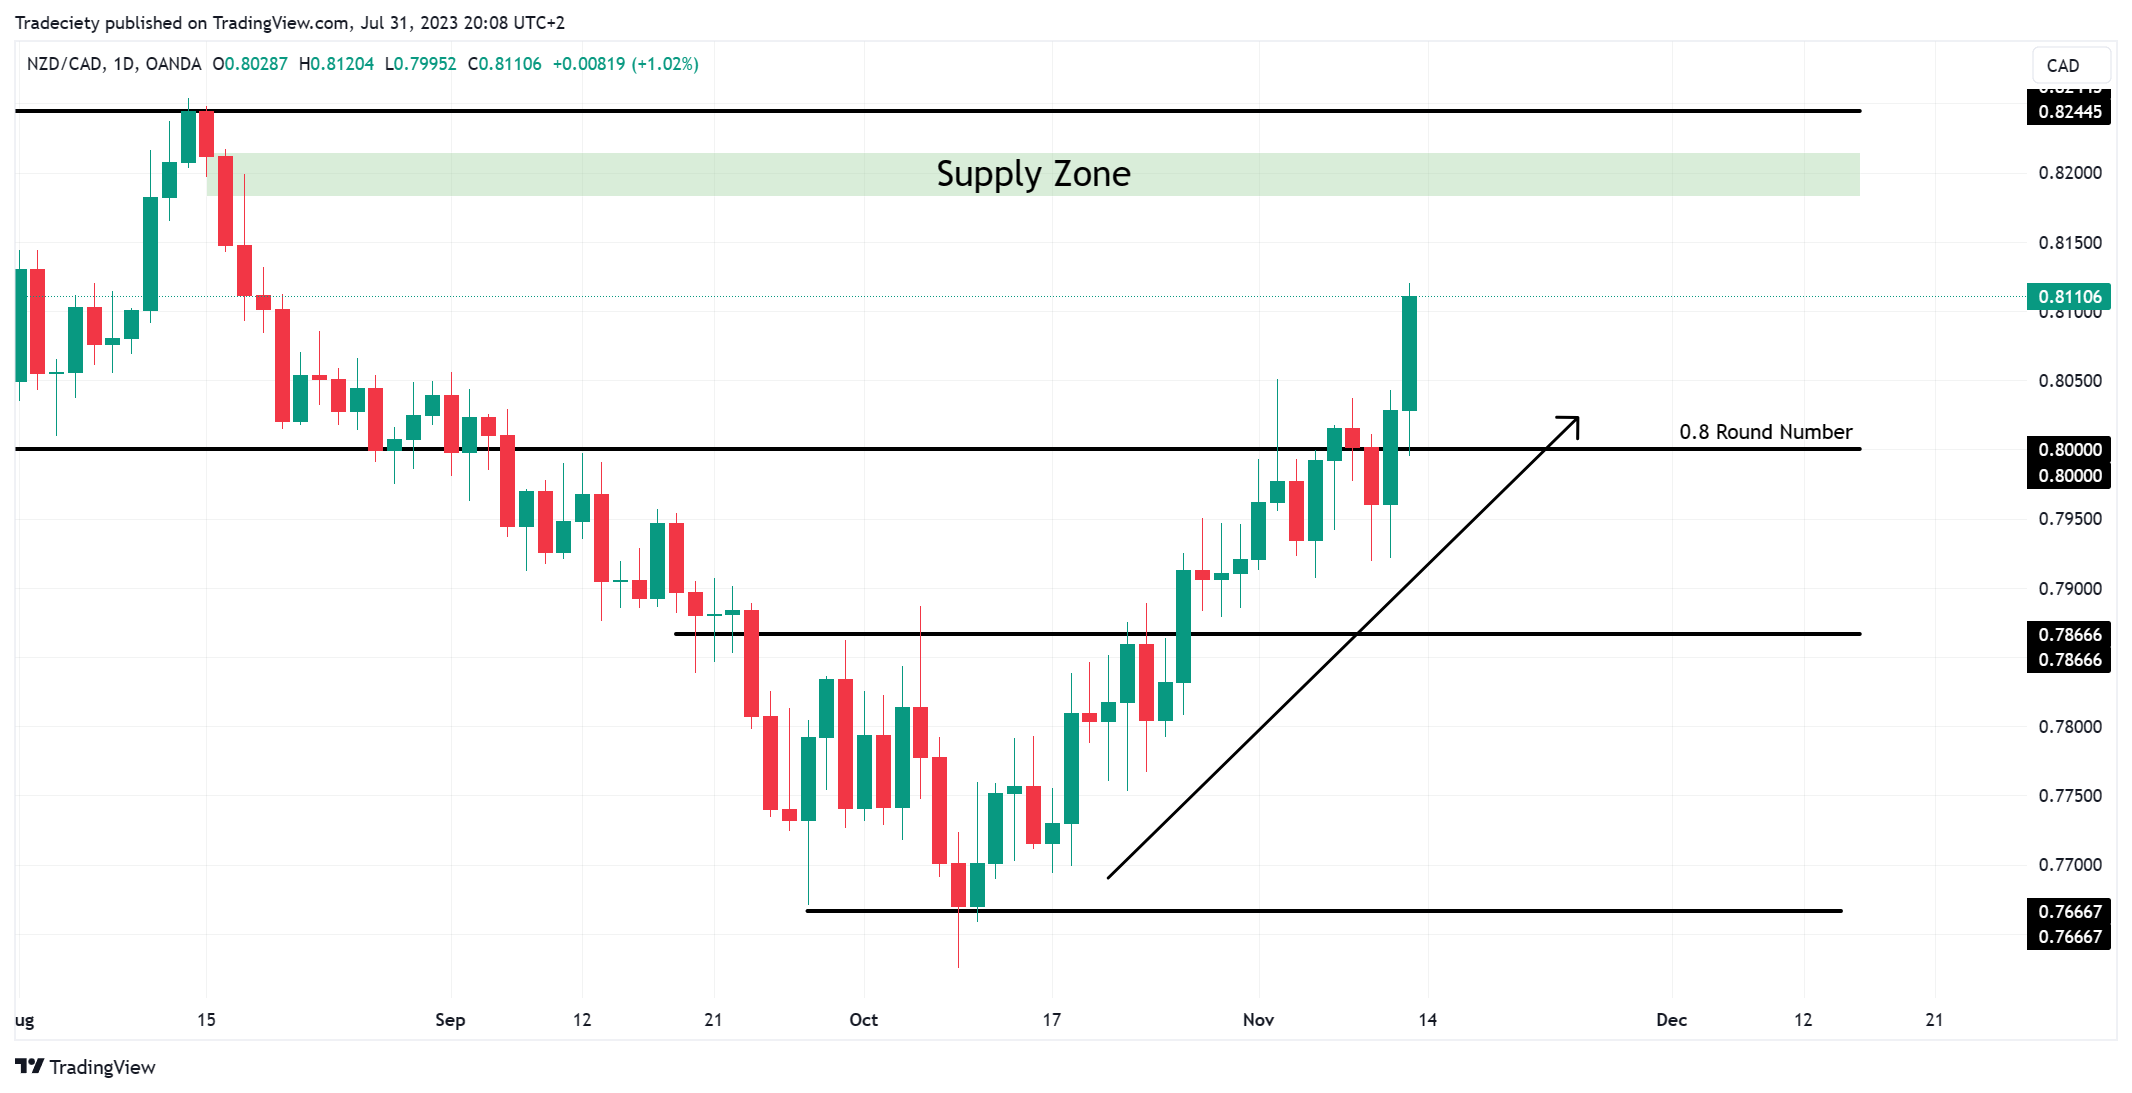
The trend analysis suggests that looking for bullish trading opportunities on the lower timeframe would fit better into the overall trend context. Bearish trades would not make sense in the current higher timeframe situation. The higher timeframe trend analysis acts as a first filter for the trade direction.
Bullish traders need to be aware of the resistance levels at the top; such levels could be used as target levels for potential bullish trading opportunities that a trader may find on the lower timeframes.